 Web Server Statistics for ncoh.net Web Server Statistics for ncoh.net
(Go To: Top: General Summary: Daily Summary: Hourly Summary: Domain Report: Organization Report: Operating System Report: Status Code Report: File Size Report: File Type Report: Directory Report: Request Report)
This report contains overall statistics.
Successful requests: 5,690
Average successful requests per day: 5,696
Successful requests for pages: 5,112
Average successful requests for pages per day: 5,118
Failed requests: 1,016
Redirected requests: 20
Distinct files requested: 371
Distinct hosts served: 843
Corrupt logfile lines: 228
Data transferred: 443.62 megabytes
Average data transferred per day: 444.24 megabytes
(Go To: Top: General Summary: Daily Summary: Hourly Summary: Domain Report: Organization Report: Operating System Report: Status Code Report: File Size Report: File Type Report: Directory Report: Request Report)
This report lists the total activity for each day of the week, summed over all the weeks in the report.
Each unit ( ) represents 150 requests
for pages or part thereof.
) represents 150 requests
for pages or part thereof.
day: #reqs: #pages: ---: -----: ------: Sun: 0: 0: Mon: 0: 0: Tue: 0: 0: Wed: 0: 0: Thu: 0: 0: Fri: 5690: 5112:
(Go To: Top: General Summary: Daily Summary: Hourly Summary: Domain Report: Organization Report: Operating System Report: Status Code Report: File Size Report: File Type Report: Directory Report: Request Report)
This report lists the total activity for each hour of the day, summed over all the days in the report.
Each unit () represents 6 requests
for pages or part thereof.
hour: #reqs: #pages: ----: -----: ------: 0: 244: 215:1: 212: 181:
3: 232: 220:
6: 241: 225:
(Go To: Top: General Summary: Daily Summary: Hourly Summary: Domain Report: Organization Report: Operating System Report: Status Code Report: File Size Report: File Type Report: Directory Report: Request Report)
This report lists the countries of the computers which requested files.
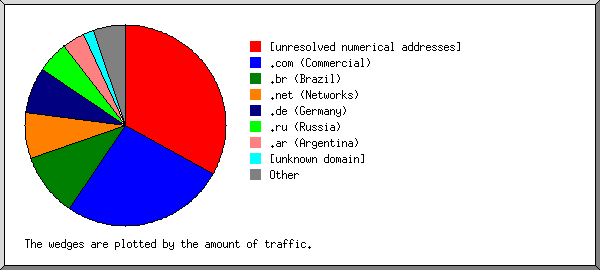
Listing domains, sorted by the amount of traffic.
#reqs: %bytes: domain
-----: ------: ------
 4701: 45.60%: [unresolved numerical addresses]
  220: 23.13%: [unknown domain]
  450: 17.94%: .com (Commercial)
  111:  4.42%: .net (Networks)
   14:  1.57%: [domain not given]
   72:  1.15%: .de (Germany)
    9:  0.78%: .mx (Mexico)
    4:  0.50%: .pl (Poland)
   20:  0.44%: .info (Informational)
    7:  0.37%: .br (Brazil)
    2:  0.29%: .it (Italy)
    9:  0.29%: .vn (Vietnam)
    3:  0.26%: .co (Colombia)
    2:  0.24%: .om (Oman)
    3:  0.24%: .my (Malaysia)
    2:  0.23%: .uy (Uruguay)
    2:  0.16%: .ca (Canada)
    1:  0.16%: .il (Israel)
    1:  0.16%: .cl (Chile)
    2:  0.16%: .bd (Bangladesh)
    1:  0.16%: .ro (Romania)
    2:  0.14%: .uk (United Kingdom)
    3:  0.14%: .fr (France)
    2:  0.14%: .org (Non Profit Making Organizations)
    2:  0.13%: .uz (Uzbekistan)
    1:  0.13%: .md (Moldova)
    1:  0.13%: .th (Thailand)
    2:  0.12%: .kz (Kazakhstan)
    1:  0.11%: .bo (Bolivia)
    4:  0.11%: .tr (Turkey)
    4:  0.10%: .ec (Ecuador)
    1:  0.10%: .in (India)
    1:  0.10%: .hn (Honduras)
    1:  0.09%: .ph (Philippines)
    1:  0.09%: .mk (Macedonia (Former Yugoslav Republic))
    1:  0.04%: .id (Indonesia)
    9:  0.03%: .ru (Russia)
    1:  0.01%: .arpa (Arpanet)
    3:  0.01%: .cn (China)
    2:       : .pt (Portugal)
    1:       : .gy (Guyana)
    1:       : .be (Belgium)
    1:       : .ae (United Arab Emirates)
    1:       : .cg (Congo)
    1:       : .us (United States)
    1:       : .fj (Fiji)
    1:       : .gr (Greece)
    1:       : .by (Belarus)
    1:       : .jp (Japan)
    1:       : .nz (New Zealand)
    1:       : .ua (Ukraine)
    1:       : .sg (Singapore)
(Go To: Top: General Summary: Daily Summary: Hourly Summary: Domain Report: Organization Report: Operating System Report: Status Code Report: File Size Report: File Type Report: Directory Report: Request Report)
This report lists the organizations of the computers which requested files.

Listing the top 20 organizations by the number of requests, sorted by the number of requests.
#reqs: %bytes: organization
-----: ------: ------------
 4086:  9.00%: 77
  220: 23.13%: [unknown domain]
  112:  6.14%: semrush.com
   72:  1.79%: amazonaws.com
   54:  0.12%: your-server.de
   37:  1.25%: 43
   34:  0.23%: sogou.com
   33:  1.03%: apple.com
   32:  0.07%: 50
   32:  0.08%: 73
   29:  0.08%: 93
   28:  0.39%: comcast.net
   20:  0.44%: bacloud.info
   20:  1.20%: 103
   20:  0.02%: ahrefs.net
   20:  3.19%: 96
   18:  0.25%: bytedance.com
   18:  0.71%: hosted-by-vdsina.com
   18:  0.04%: msn.com
   17:  0.03%: 172.56
  770: 50.81%: [not listed: 318 organizations]
(Go To: Top: General Summary: Daily Summary: Hourly Summary: Domain Report: Organization Report: Operating System Report: Status Code Report: File Size Report: File Type Report: Directory Report: Request Report)
This report lists the operating systems used by visitors.
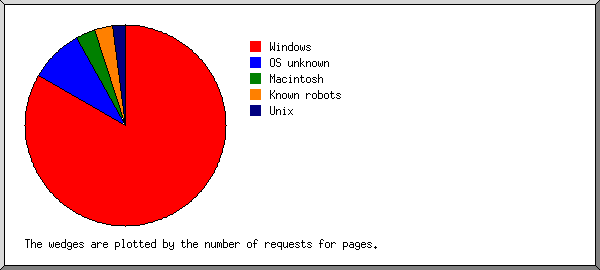
Listing operating systems, sorted by the number of requests for pages.
 #: #reqs: #pages: OS
--: -----: ------: --
 1:  4550:   4375: Windows
  :  4508:   4356:   Windows NT
  :    39:     18:   Unknown Windows
  :     2:      1:   Windows 2000
  :     1:      0:   Windows CE
 2:   480:    355: OS unknown
 3:   339:    210: Macintosh
 4:   188:    105: Unix
  :   188:    105:   Linux
 5:   110:     44: Known robots
(Go To: Top: General Summary: Daily Summary: Hourly Summary: Domain Report: Organization Report: Operating System Report: Status Code Report: File Size Report: File Type Report: Directory Report: Request Report)
This report lists the HTTP status codes of all requests.
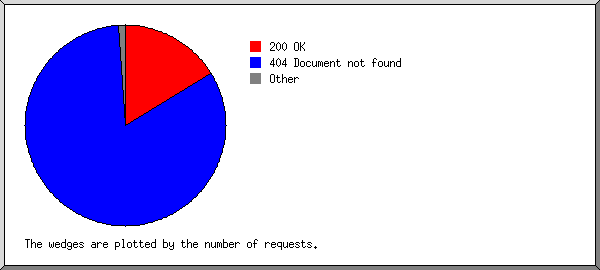
Listing status codes, sorted numerically.
#reqs: status code
-----: -----------
 5665: 200 OK
   13: 206 Partial content
   20: 301 Document moved permanently
   12: 304 Not modified since last retrieval
 1016: 404 Document not found
(Go To: Top: General Summary: Daily Summary: Hourly Summary: Domain Report: Organization Report: Operating System Report: Status Code Report: File Size Report: File Type Report: Directory Report: Request Report)
This report lists the sizes of files.
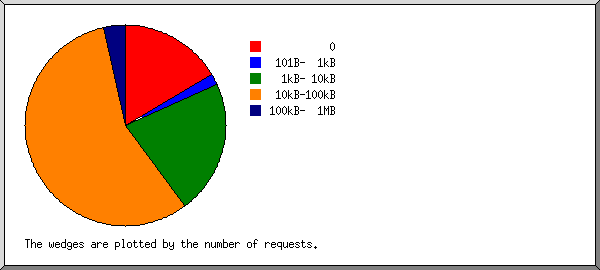
       size: #reqs: %bytes:
-----------: -----: ------:
          0:    22:       :
   1B-  10B:     0:       :
  11B- 100B:     1:       :
 101B-  1kB:    40:  0.01%:
  1kB- 10kB:   276:  0.41%:
 10kB-100kB:  4692: 10.93%:
100kB-  1MB:   659: 88.65%:
(Go To: Top: General Summary: Daily Summary: Hourly Summary: Domain Report: Organization Report: Operating System Report: Status Code Report: File Size Report: File Type Report: Directory Report: Request Report)
This report lists the extensions of files.

Listing extensions with at least 0.1% of the traffic, sorted by the amount of traffic.
#reqs: %bytes: extension
-----: ------: ---------
  677: 88.64%: .html [Hypertext Markup Language]
 4435:  9.86%: [directories]
  376:  0.95%: .php  [PHP]
   65:  0.23%: .jpg  [JPEG graphics]
    8:  0.16%: .pdf  [Adobe Portable Document Format]
  129:  0.16%: [not listed: 8 extensions]
(Go To: Top: General Summary: Daily Summary: Hourly Summary: Domain Report: Organization Report: Operating System Report: Status Code Report: File Size Report: File Type Report: Directory Report: Request Report)
This report lists the directories from which files were requested. (The figures for each directory include all of its subdirectories.)

Listing directories with at least 0.01% of the traffic, sorted by the amount of traffic.
#reqs: %bytes: directory
-----: ------: ---------
 4698: 84.90%: /priv_stats/
  185: 13.04%: http://
  286:  0.90%: /services/
  217:  0.58%: [root directory]
  114:  0.28%: /images/
   52:  0.12%: /about/
   31:  0.06%: /contact.php/
   26:  0.05%: /news/
   75:  0.05%: /include/
    3:  0.01%: /tests/
    3:  0.01%: [not listed: 2 directories]
(Go To: Top: General Summary: Daily Summary: Hourly Summary: Domain Report: Organization Report: Operating System Report: Status Code Report: File Size Report: File Type Report: Directory Report: Request Report)
This report lists the files on the site.
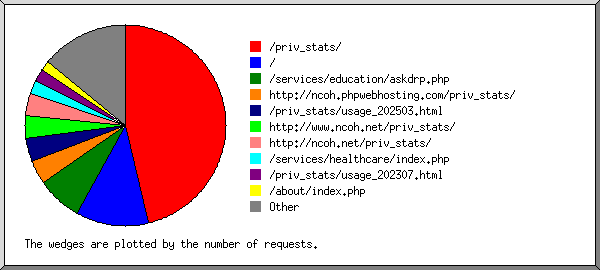
Listing files with at least 20 requests, sorted by the number of requests.
#reqs: %bytes:          last time: file
-----: ------: ------------------: ----
 4122:  9.08%: Jul/31/26 11:59 PM: /priv_stats/
  208: 33.12%: Jul/31/26 11:56 PM: /priv_stats/usage_202607.html
  165:  0.46%: Jul/31/26 11:55 PM: /
   88:  0.27%: Jul/31/26 11:54 PM: /services/education/askdrp.php
   82: 12.62%: Jul/31/26  4:37 PM: /priv_stats/usage_202606.html
   50:  0.11%: Jul/31/26  9:58 PM: /services/education/index.php
   36:  0.08%: Jul/31/26  9:58 PM:   /services/education/index.php?pg=resources
   48:  6.25%: Jul/31/26 11:58 PM: /priv_stats/usage_202307.html
   44:  4.38%: Jul/31/26 11:49 PM: /priv_stats/usage_202206.html
   44:  0.11%: Jul/31/26 11:26 PM: /about/index.php
   20:  0.05%: Jul/31/26 11:26 PM:   /about/index.php?pid=2
   12:  0.03%: Jul/31/26 10:17 PM:   /about/index.php?pid=1
   34:  0.01%: Jul/31/26 11:37 PM: /include/navigate.js
   32:  0.03%: Jul/31/26 11:37 PM: /include/ncoh2.css
   29:  4.62%: Jul/31/26 11:50 PM: /priv_stats/usage_202604.html
   28:  0.08%: Jul/31/26  4:13 PM: http://www.ncoh.net/services/education/askdrp.php
   24:  0.05%: Jul/31/26 11:40 PM: /contact.php
   23:  0.06%: Jul/31/26  6:09 PM: /services/healthcare/index.php
   22:  0.03%: Jul/31/26 10:12 PM: /images/logo23.gif
   22:  2.29%: Jul/31/26  9:59 PM: /priv_stats/usage_202203.html
   21:  0.07%: Jul/31/26 11:00 PM: /services/education/askdrp.php/trackback/
  604: 26.37%: Jul/31/26 11:50 PM: [not listed: 226 files]
(Go To: Top: General Summary: Daily Summary: Hourly Summary: Domain Report: Organization Report: Operating System Report: Status Code Report: File Size Report: File Type Report: Directory Report: Request Report)


